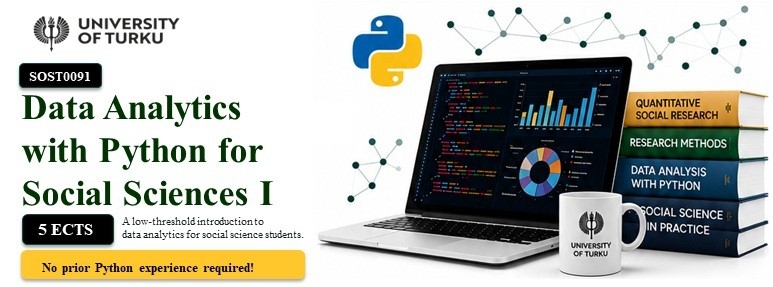
- Institution
- University of Turku
- Extent
- 5 ECTS
- Level
- Advanced studies / Master’s level
- Teaching language
- English
- Course period
- 3 November–18 December 2026
- Assessment
- Pass/Fail
- Prerequisite
- Bachelor-level quantitative methods or Statistics I, or equivalent studies
- Previous Python experience
- Not required
Course description
This course provides a practical introduction to quantitative data analysis with Python for social science students. It begins with research questions, concepts, variables and measurement before moving to data inspection, cleaning, transformation, descriptive statistics, visualisation and statistical testing.
The course uses Excel as a bridge between reading data manually and creating transparent Python workflows. Students work with authentic survey, country-level, administrative and public datasets. The course emphasises clear interpretation, careful documentation and reproducible analysis in Jupyter Notebook.
Learning outcomes
After completing the course, students should be able to:
- explain the connection between research questions, concepts, variables and measurement;
- inspect the structure and unit of analysis of a dataset;
- clean, manage and transform survey and macro-social datasets;
- identify and document missing values;
- calculate and interpret descriptive statistics;
- create clear and accessible data visualisations;
- conduct and interpret t-tests, chi-square tests and analysis of variance;
- evaluate assumptions, limitations and possible sources of bias;
- distinguish description, association, prediction and causation; and
- produce a documented and reproducible analysis in Jupyter Notebook.
Course content and session sequence
| Session | Topic |
|---|---|
| 1 | From Social Science Questions to Data |
| 2 | From Research Questions to Analysable Data |
| 3 | Inspecting and Summarising Social Science Data: Excel I |
| 4 | Excel II: Group Comparison, Visualisation, Lookup and Regression Preview |
| 5 | Computer Lab I: Opening, Inspecting and Cleaning ESS Survey Data |
| 6 | Python I: Cleaning and Reshaping WDI Macro Data |
| 7 | Python II: Missing Data and Analysis-Ready GSS Records |
| 8 | Computer Lab II: Reproducibility, Debugging and Gapminder |
| 9 | Descriptive Statistics and Exploratory Data Analysis |
| 10 | Python Visualisation: Honest, Accessible Social Science Charts |
| 11 | Computer Lab III: A Mini Visual EDA Report |
| 12 | Probability and Variability |
| 13 | Hypothesis Testing with Descriptives First |
| 14 | Full Analysis Pipeline: From Raw Table to Mini-Project Draft |
| 15 | Statistical-Learning Bridge |
| 16 | Review and Consolidation: Repair the Workflow |
Teaching and learning methods
The course combines lectures, computer laboratories, live demonstrations, paper-based data activities, Excel exercises, Jupyter Notebook exercises, Moodle activities, H5P exercises, Kahoot quizzes, individual tasks and collaborative problem-solving.
question → inspect → transform → summarise → interpret → practise
Computer-laboratory sessions focus on practical work, debugging, feedback and reproducibility. Students are expected to run their notebooks from a fresh kernel and verify that the complete workflow can be reproduced.
Datasets
The course uses datasets such as:
- European Social Survey;
- General Social Survey;
- World Development Indicators;
- World Inequality Database;
- Humanitarian Data Exchange;
- Gapminder;
- World Happiness Report;
- Freedom House;
- Statistics Finland;
- UCI Student Performance; and
- selected teaching datasets derived from social science research.
Tools and software
- Python
- pandas
- NumPy
- Matplotlib
- Jupyter Notebook
- Visual Studio Code
- Excel
- Noppe cloud platform
Assessment
Assessment focuses on the correctness of the analysis, quality of interpretation, transparency of the workflow and clarity of reporting. Students must complete at least 80% of the course requirements to pass.
| Assessment component | Weight |
|---|---|
| Weekly hands-on exercises | 30% |
| Data-analysis report | 40% |
| Final mini-project | 30% |
Workload
- Lecture instruction: 24 hours
- Computer-laboratory teaching: 16 hours
- Independent study: approximately 95 hours
- Final assessment and mini-project session: 4 hours
Loading comments…